- D/618/7406 Unit 5: Challenges of IT Security in Modern Organizations – Risks, Solutions & Best Practices
- HSC Level 2/3 Unit 012 Assignment: Care Worker Responsibilities and Ways of Working
- CIPD Level 5HR03 Assignment: Understanding Reward Approaches and Their Impact on Performance and Contribution
- CIPD level 5HR02 Assignment: Talent Management and Workforce Planning Unit Guide
- Level 3 D/615/3823 Assignment: Regulation, Protection, and Collaborative Practice in Health and Social Care
- PGM216D Assignment: Bicycle Store Sales Management Application
- MATH6033 Assignment: Epidemiological Investigation of Cardiovascular Health and Tea Consumption Risks
- EH6147 Assingment: Stakeholder Analysis for Quality Improvement in Hand Hygiene Compliance
- Assignment: Investigation of Solution Concentration Through Standard Preparation, Titration, and Colorimetry Techniques
- MATH6033 Assignment: Cardiovascular Risk and Tea Drinking: Epidemiological Analyses
- CIPD level 3 3CO03 Assignment: Core behaviours for people professionals
- DAC4B1: Personal development in adult care settings
- Unit 19 Research Project Assignment 1: Impact of Corporate Social Responsibility on Business Success & Community Wellness
- EG5022 Assignment: Georeferencing and Accuracy Assessment of a Quarry 3D Model Using Photogrammetric GCPs
- Assignment: Financial Performance and Strategic Analysis of a UK Listed Company: A CORE Evaluation and Reflective Review
- 5CNMN002W Assignment: Advanced measurement- Major measurement taking off
- K/650/2298 Level 3 Understanding Roles, Responsibilities, and Effective Partnerships in Health and Social Care
- Understanding Information and Knowledge Management in the Workplace: A Briefing for HR Professionals
- HRM7010D Strategic Use of People Analytics in Enhancing Organisational Value and Agility
- TOWN1060 Urban Planning in the UK History Sustainable Design and Future City Development
The Excel sheet uses data from the control group (30g glucose drink), a “cornflakes group” and an “All Bran group”: Nutrition Assignment, LHU, UK
| University | Liverpool Hope University (LHU) |
| Subject | Nutrition |
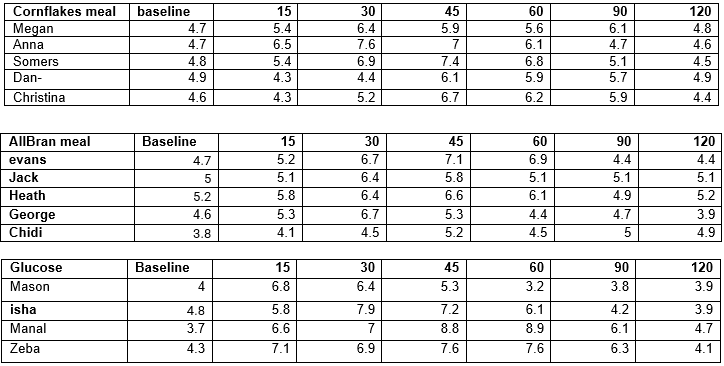
Q1. The Excel sheet uses data from the control group (30g glucose drink), a “cornflakes group” and an “All Bran group”. In the space below, draw a figure showing the time course for the changes in glucose concentration in the three groups. This figure should include an estimate of variability (SEM or SD) and a figure legend
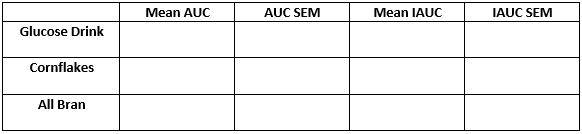
Q2. Using Excel, calculate the mean and SEM for the AUC and the IAUC for the glucose, cornflakes, and all bran groups.
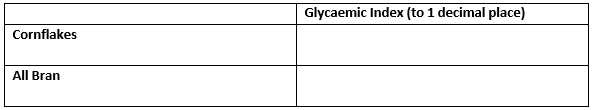
Q3. Based on your data in question 2, calculate the Glycaemic Index of both cornflakes and All bran using the AUC.
Do You Need Assignment of This Question
Are you struggling to keep up with your academic workload? Do you find it difficult to complete your essays and assignments on time? Look no further than studentsassignmenthelp.co.uk! We offer top-quality essay writing help that is tailored to meet your unique needs and requirements. Our team of experienced writers are dedicated to delivering high-quality, original work that is guaranteed to earn you top grades. Whether you need help with research, writing, or editing, our assignment experts are here to assist you every step of the way. Plus, with our affordable pricing and 24/7 support, you can rest assured that you are getting the best value for your money. So why wait? Contact us today to get started on your path to academic success!
Answer


